
Student loan repayment statistics suggest that many student loan borrowers are struggling to repay their student loans. However, these statistics are attributable mostly to borrowers who drop out of college and not to borrowers who graduate. College dropouts have the debt, but not the degrees that can help them repay the debt. Thus, we don’t have a student loan problem, at least not yet, so much as a college completion problem.
True, the likelihood of default increases as the amount of debt and the debt-to-income ratio increases, but this is not yet the dominant driver of non-performing loans. That’s why the average debt of defaulted borrowers is relatively low. Students who graduate tend to borrow more than students who drop out of college.
Currently, borrowing excessively to pay for college is more a matter of choice than a matter of necessity.
But, if current trends continue, average debt at graduation will exceed the average income of college graduates. As debt-to-income ratios grow, there will be a cascading effect on the next generation. Families will become more sensitive to the net price of a college degree and the return on investment.
The consequential shifts in enrollment patterns will force more colleges to close or merge, especially among small, high-cost, tuition dependent private colleges that are not well known nationally. Except for about 300 colleges, most colleges do not have significant endowments.
Thus, we will eventually have a student loan problem, probably within the next two decades. The time to deal with the problem is now, before the problem grows much worse.
For the last five decades, federal and state government support of postsecondary education has failed to keep pace with increases in college costs on a per-student, inflation-adjusted basis. This has shifted the burden of paying for college from the government to families. Since family income has been flat since the late 1990s, families have been forced to either shift enrollment to lower-cost colleges or to borrow more. Lower-income students have also been priced out of a college education.
At the same time, college enrollment has doubled, forcing colleges to do more with less. Increased student-faculty ratios and increased reliance on part-time faculty has affected the quality of education. The problem will become more acute as the K-12 pipeline of traditional college students continues to shrink. This will prevent colleges from compensating for cuts in government revenue by increasing enrollment, especially from full-pay students.
The only solution is for the federal and state governments to start paying their fair share of college costs, to ensure that a college education remains affordable. The government gains substantial financial benefits from higher education, through increased tax revenue. A college graduate pays more than double the federal income tax of a high school graduate because of higher income.
Increasing government grants or other financial support of postsecondary education will pay for itself within a bit more than a decade because of the increased tax revenue. Since most people work for 45 years, that yields more than 30 years of pure profit for the government, potentially enabling a future cut in tax rates. An investment in our greatest asset, our people, will yield the equivalent of a 14% annualized return on investment. It is not just a great investment. There is no better investment.
Students Who Borrow Excessively
A student is said to borrow excessively for their college education when their total student loan debt at graduation exceeds their annual income after graduation. This is the equivalent of monthly student loan payments on a 10-year term exceeding 10% of gross monthly income.
Excessive student loan debt makes it more difficult for the borrower to repay their student loans within a reasonable amount of time, such as 10 years. It also causes delays in achieving other financial goals. Often, they must choose alternate repayment plans, like extended repayment or income-driven repayment. These repayment plans reduce the monthly student loan payment by increasing the repayment term.
This chart shows the percentage of Bachelor’s degree recipients each year who graduate with excessive student loan debt. Students who borrow more or earn less are more likely to graduate with excessive debt. This chart is based on data from the 1993-94, 2000-01 and 2007-08 Baccalaureate and Beyond (B&B) longitudinal studies and on data from a similar study conducted before 1993, the 1976-77, 1985-86 and 1989-90 Survey of Recent College Graduates (RCG).
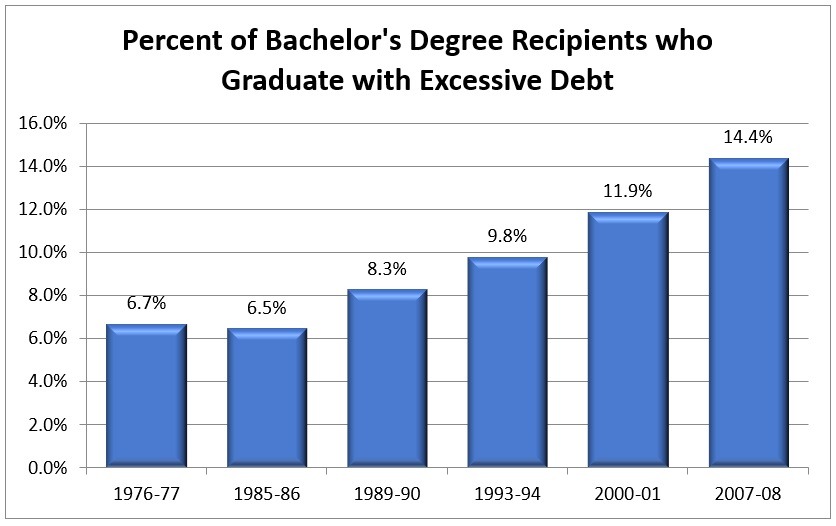
Notice the steady increase in the percentage of students graduating with excessive debt. If current trends continue, about 1 in 6 Bachelor’s degree recipients graduates with excessive debt today.
This chart recasts the same data as the percentage of Bachelor’s degree recipients who borrowed to pay for their education, as opposed to the percentage of all Bachelor’s degree recipients.

The result is a flattening out of the chart. Of those who borrow, slightly more than a quarter graduate with excessive student loan debt. This trend has been steady for two decades, suggesting that the growth in students graduating with excessive debt is due largely to the growth in borrowing and not due to increased recklessness.
Student Loan Repayment Status
Student loan status refers to the repayment status of the loan, whether it is not yet in repayment (e.g., in-school and grace periods), in repayment, in an authorized non-payment status (e.g., deferment, forbearance) or in default.
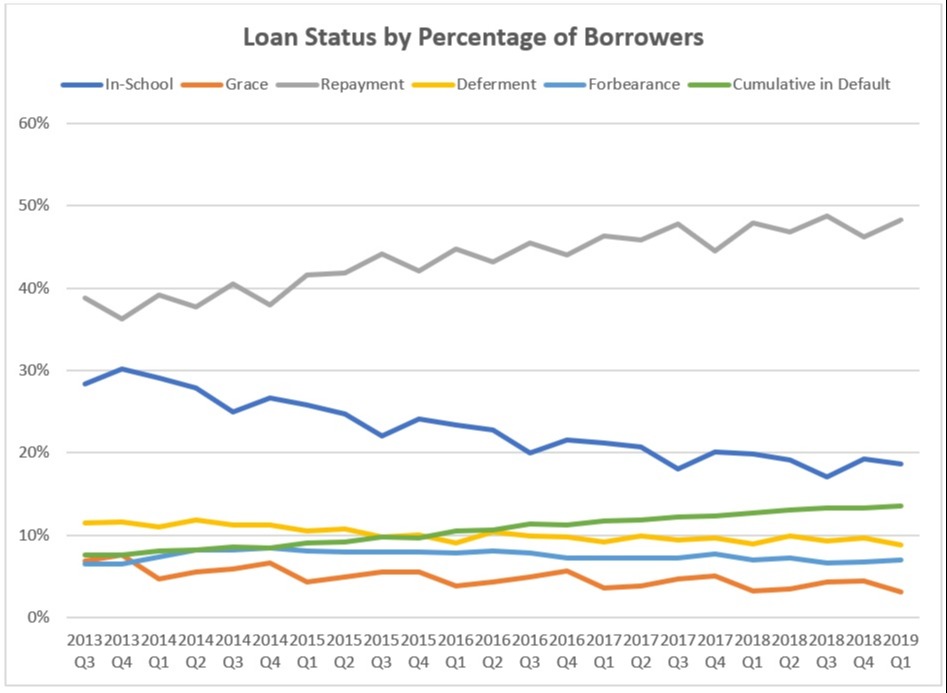
This chart shows how the distribution of loans by the percentage of borrowers in each loan status has changed from 2013 to the present. The percentage of borrowers in active repayment has been increasing over time. Likewise, the percentage of borrowers in default has also been increasing, albeit at a slower rate. The chart also shows that the percentage of borrowers in an in-school or grace period has been decreasing, since the number of borrowers in these statuses is more or less fixed while the overall portfolio grows.
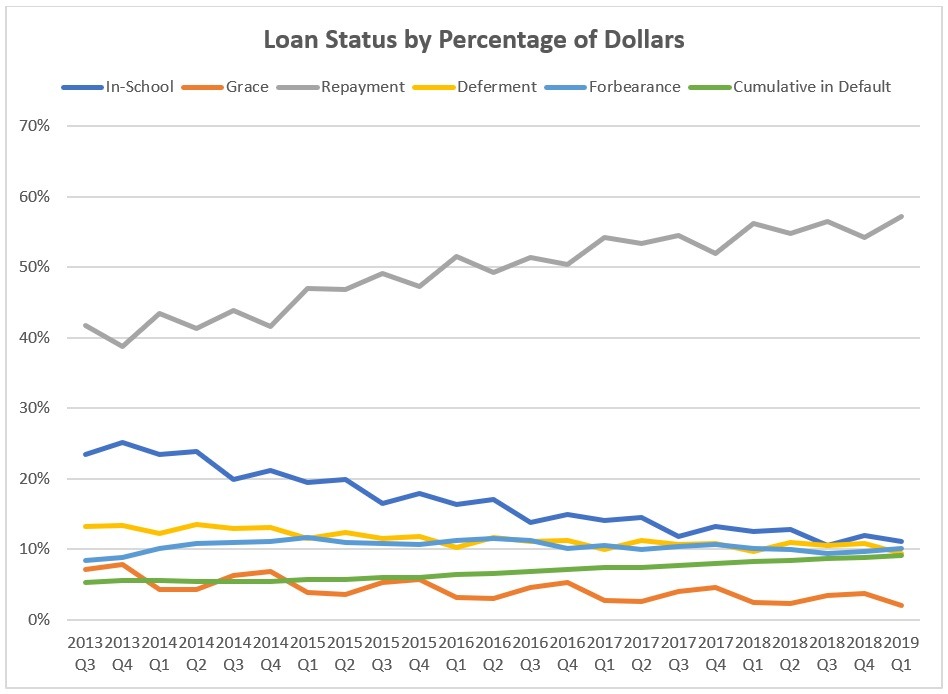
This chart shows the same results, but based on the percentage of loan dollars as opposed to the percentage of the number of borrowers.
This table shows the distribution of loan dollars and the number of borrowers by loan status in the Direct Loan portfolio, based on data from the FSA Data Center for Q1 of FY2019. The Other category includes borrowers in bankruptcy or disability.
Loan Status |
% of Dollars |
% of Borrowers |
In-School Period |
11.2% |
18.7% |
Grace Period |
2.1% |
3.1% |
Repayment |
57.2% |
48.3% |
Deferment |
9.5% |
8.8% |
Forbearance |
10.2% |
7.0% |
Cumulative in Default |
9.1% |
13.5% |
Other |
0.7% |
0.5% |
This table shows the distribution of loan dollars and the number of borrowers by loan status in the FFEL program portfolio, based on data from the FSA Data Center for Q1 of FY2019.
Loan Status |
% of Dollars |
% of Borrowers |
In-School Period |
0.1% |
0.0% |
Grace Period |
0.0% |
0.0% |
Repayment |
61.5% |
59.6% |
Deferment |
4.5% |
4.4% |
Forbearance |
8.5% |
6.6% |
Cumulative in Default |
24.0% |
28.7% |
Other |
1.3% |
0.7%
|
Student Loan Delinquency and Default
This table shows the delinquency status of loans in repayment for the Direct Loan portfolio, based on data from the FSA Data Center for Q1 of FY2019.
Delinquency Status |
% of Dollars |
% of Borrowers |
Current Repayment |
86.7% |
83.3% |
31-90 Days Delinquent |
5.9% |
6.7% |
91-180 Days Delinquent |
3.6% |
4.6% |
181-270 Days Delinquent |
2.3% |
3.2% |
271-360 Days Delinquent |
1.5% |
2.2% |
A serious delinquency occurs after a loan is 90 or more days delinquent. As this table demonstrates, just 7.4% of loan dollars and 10.0% of loan borrowers in the Direct Loan program are in a serious delinquency.
When a federal loan is more than 360 days delinquent, it is considered to be in default. (Private student loans, on the other hand, require just 120 days of delinquency for a loan to be in default.) Most student loan delinquencies do not proceed through to a default.
This chart, which is based on data from the Household Debt and Credit Report (Q1 of 2019) shows the percentage of loan dollars that is in a serious delinquency for various types of debt.
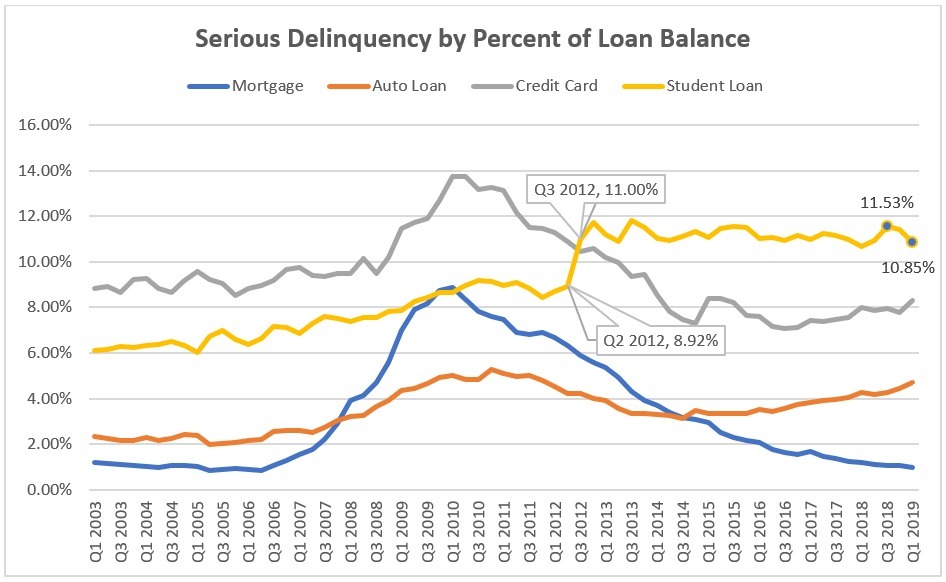
As highlighted in the chart, student loan serious delinquencies experienced a sharp increase from 8.92% in Q2 of 2012 to 11.00% in Q3 of 2012. This increase is not aligned with the peaks of serious delinquencies for other types of debt, all of which occurred in 2010 at the end of the economic downturn. Note that a serious delinquency starts one quarter earlier.
It is unclear what triggered this sharp increase in serious student loan delinquencies. Possibilities include
- The introduction of an in-school deferment for Federal Parent PLUS loans in July 2008. Before passage of the Ensuring Continued Access to Student Loans Act (ECASLA) in 2008, Federal Parent PLUS loans entered repayment within 60 days of full disbursement.
- The switch to 100% Direct Lending in July 2010.
- The change in the definition of an adverse credit history in the Direct Loan program in October 2011.
This chart shows the cohort default rates for federal student loans. The cohort default rate is a short-term default rate measure that reports the percentage of loans entering repayment one federal fiscal year that default by the end of a subsequent federal fiscal year. Congress switched from a 2-year cohort default rate to a 3-year cohort default rate starting in FY2009, but there were several years before and after the transition during which both cohort default rates were reported.
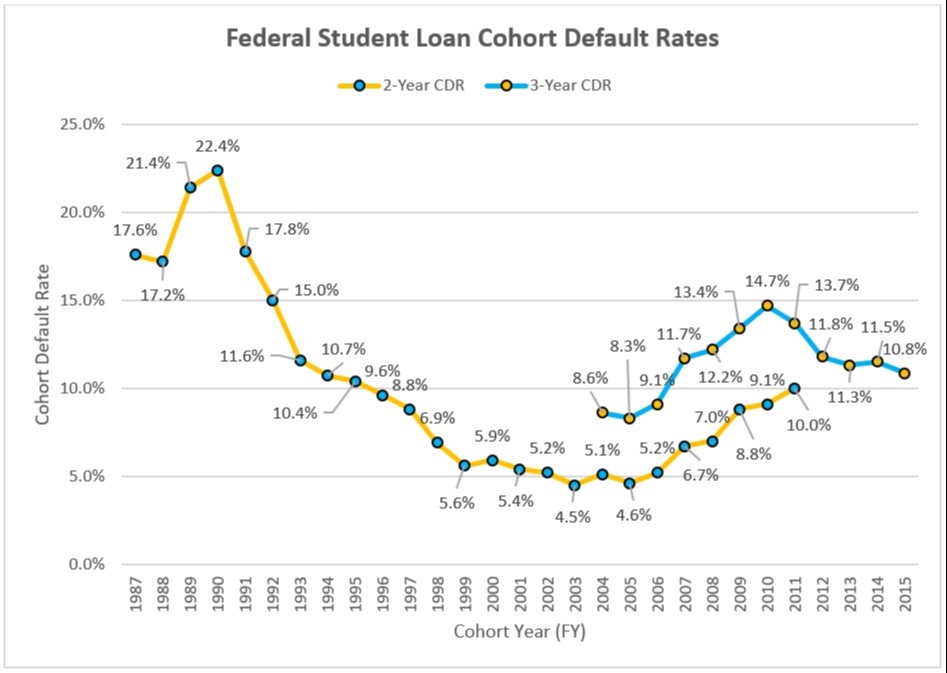
More than one million borrowers default for the first time each year. Of these, more than half defaulted within the first three federal fiscal years after entering repayment.
The FY2015 federal cohort default rates are 10.3% for public colleges (7.2% for public 4-year colleges and 16.7% for community colleges), 7.1% for private non-profit colleges (6.7% for private non-profit 4-year colleges) and 15.7% for private for-profit colleges). Despite the high default rate, for-profit colleges represent only a third (34.4%) of the defaults. Public colleges account for more than half of the defaults (50.8%) and private non-profit colleges about a seventh (14.8%).
This table provides data concerning federal student loans in default as of Q1 of FY2019. Note that default rates are not comparable among the loan programs, as the mix of loans in each portfolio demonstrates a different aging. The loans in repayment limits the denominator to loans that have entered repayment, excluding loans in an in-school or grace period.
Loan Program |
Loan Dollars in Default |
Number of Borrowers In Default |
% of Total Loan Borrowers |
% of Total Loan Dollars |
% of Loan Borrowers In Repayment |
% of Loan Dollars in Repayment |
Direct Loans |
$105.8 billion |
5.2 million |
13.5% |
9.1% |
17.3% |
10.5% |
FFEL Program |
$66.5 billion |
3.9 million |
28.7% |
24.0% |
28.7% |
24.1% |
ED-Held FFEL |
$39.6 billion |
2.8 million |
43.4% |
44.0% |
43.5% |
44.2% |
TOTAL |
$211.9 billion |
|
|
13.8% |
|
15.4% |
Note that the TOTAL line omits figures based on the number of borrowers because there is overlap among the borrowers in the three loan programs, with some borrowers having loans in more than one of the loan programs.
The total federal loans in default has increased 41% in just three years, from $150.3 billion in Q1 of FY2016 to $211.9 billion in Q1 of FY2019.
More than $10 billion in defaulted federal loans are recovered annually, with 72% recovered through rehabilitation, 14% by consolidation, 9% by wage garnishment and 5% by voluntary payments.
Despite the trends in cumulative defaults, very few borrowers who graduate with a Bachelor’s degree default on their federal student loans. Based on data from the 2012 follow-up to the 2008 Baccalaureate and Beyond Longitudinal Study (B&B:08/12), the overall default rate for Bachelor’s degree recipients is 1.76%.
Students who drop out of college are much more likely to default on their student loans. Based on data from the 2009 follow-up to the 2003-04 Beginning Postsecondary Students longitudinal study (BPS:04/09), college dropouts are 4.2 times more likely to default on their federal student loans than college graduates. About two-thirds (63%) of defaults on federal student loans are from college dropouts, not college graduates. First-generation college students are also 2.7 times more likely to default on their federal student loans.
Thus, there really isn’t a student loan problem, so much as a college completion problem. College dropouts have the debt, but not the degree that can help them repay the debt.
Nevertheless, the likelihood of default increases with the amount of debt and with higher debt-to-income ratios. So, even though we do not currently have a student loan problem, debt levels will eventually grow high enough to cause a significant increase in default rates even among college graduates.
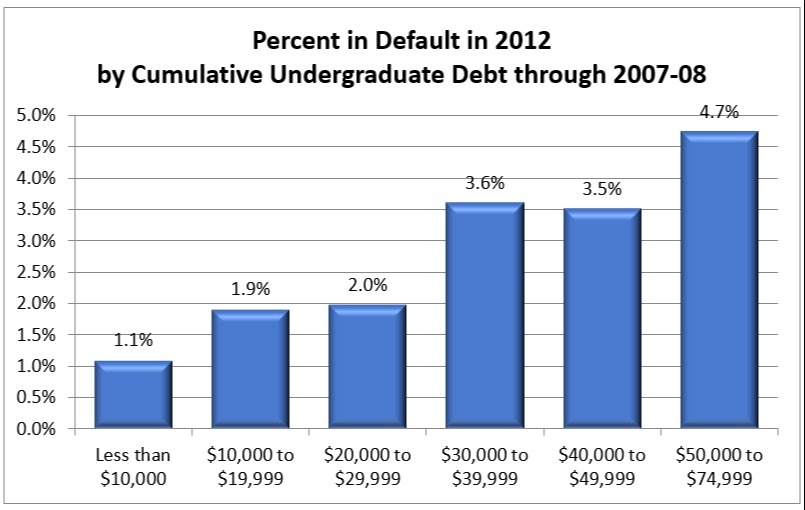
This chart shows that default rates for Bachelor’s degree recipients remain low even four years after graduation. The default rates correlate with the amount of debt at graduation.
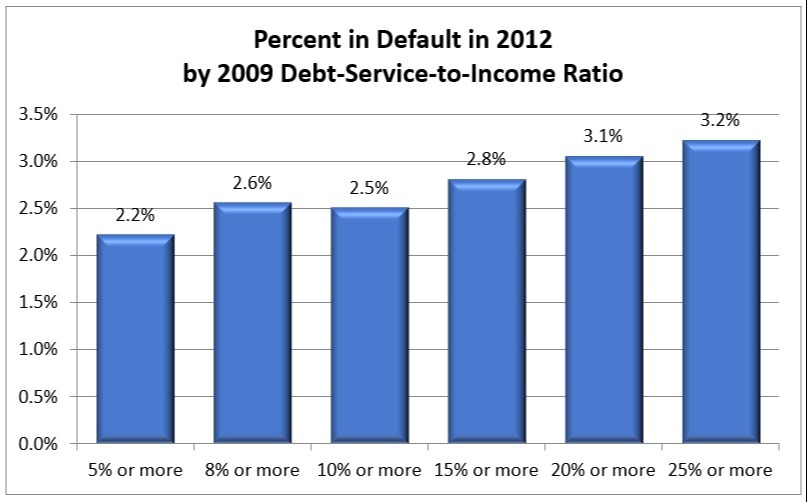
This chart shows that default rates for Bachelor’s degree recipients correlate with debt-to-income ratios.
Older Borrowers are More Likely to be in Default on their Student Loans
A 2016 U.S. Government Accountability Office (GAO) report concerning the offset of Social Security benefits to repay defaulted federal student loans, GAO-17-45, found that 29% of borrowers age 50-64 and 37% of borrowers age 65+ were in default, compared with 17% of borrowers under age 50. About half owed less than $10,000 when they were first subject to Social Security offset. Even though borrowers age 65+ represent only 2% of borrowers with federal student loans, they are twice as likely to be in default as compared with borrowers under age 50.
Student Loan Deferment and Forbearance
This table shows the distribution of Direct Loans by the type of deferment, based on data from the FSA Data Center in Q1 of FY2019. More than 90% of deferments are for borrowers in an in-school or grace period.
Type of Deferment |
% of Dollars |
% of Borrowers |
In-School |
85.0% |
87.8% |
Six-Month Post Enrollment |
5.5% |
4.5% |
Unemployment |
5.6% |
4.5% |
Economic Hardship |
3.2% |
3.0% |
Military |
0.2% |
0.3% |
Student Loan Repayment Plans
This table shows the distribution of Direct Loans by the type of repayment plan, based on data from the FSA Data center in Q1 of FY2019. Although the available data distinguishes between borrowers in a standard 10-year repayment term and longer repayment terms, the data does not specify whether borrowers in a longer repayment term are in a 12, 15, 20, 25 or 30-year repayment term.
Repayment Plan |
% of Dollars |
% of Borrowers |
Average Debt |
Level: 10 Years or Less |
25.3% |
45.6% |
$19,289 |
Level: > 10 Years |
9.0% |
6.9% |
$45,465 |
Graduated: 10 Years or Less |
10.2% |
12.4% |
$28,392 |
Graduated: > 10 Years |
1.8% |
1.3% |
$49,219 |
Income-Contingent |
3.6% |
2.7% |
$45,441 |
Income-Based |
19.5% |
11.3% |
$60,213 |
Pay As You Earn |
9.8% |
5.2% |
$65,115 |
REPAYE |
16.7% |
10.2% |
$56,563 |
Alternative |
4.2% |
4.3% |
$33,889 |
Any IDR |
49.5% |
29.5% |
$58,453 |
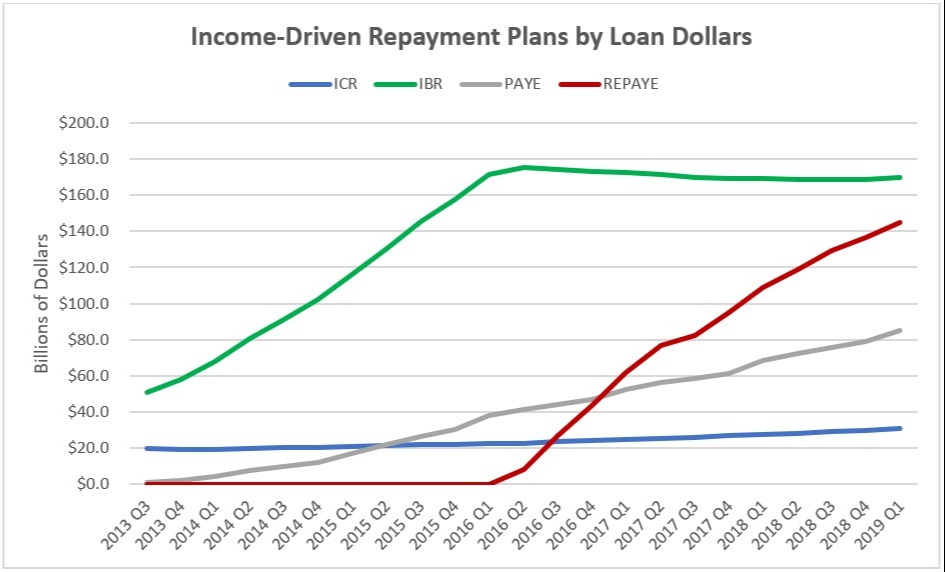
This chart shows the change in the distribution of loan dollars among the four income-driven repayment plans in the Direct Loan program, based on data from the FSA Data Center. The trends involving the number of borrowers are similar. This chart demonstrates that growth in the REPAYE repayment plan came mostly from a decline in use of IBR by new borrowers, but also from a slight slowing of the growth in the PAYE repayment plan.
This raises concerns because PAYE is a superior repayment plan to REPAYE for all borrowers who are eligible. Even IBR may be better than REPAYE for some borrowers because IBR has a cap on the monthly loan payment and does not have a marriage penalty like REPAYE. The U.S. Department of Education may have been aggressively promoting the REPAYE repayment plan instead of PAYE and IBR because it is less expensive for the federal government, even when it is not in the borrower’s best financial interest.
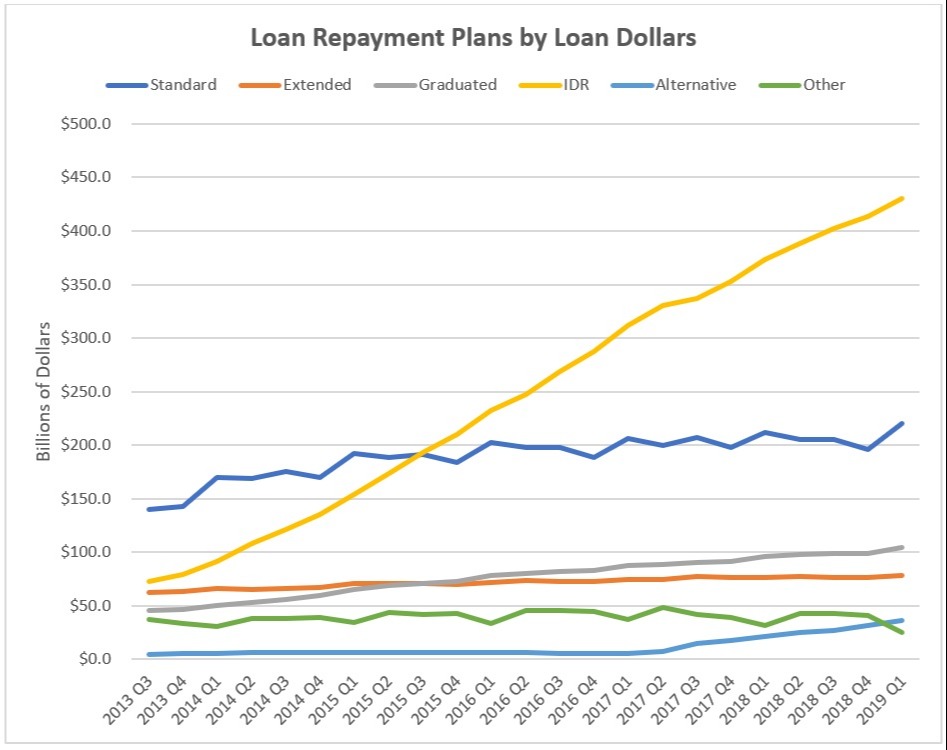
This chart shows that most of the growth in student loan borrowing has occurred in the income-driven repayment plans. Use of income-driven repayment plans will collectively exceed the combined use of all other repayment plans sometime in 2020 if current trends continue.
Public Service Loan Forgiveness (PSLF)
Very few borrowers who have applied for Public Service Loan Forgiveness (PSLF) have received forgiveness as of March 31, 2019. Of the 73,554 borrowers applying for PSLF, only 518 (0.7%) have been approved. A total of $30,688,445 has been forgiven, or an average of $59,244 per borrower.
According to the U.S. Department of Education, the reasons for rejection include:
- 53% insufficient qualifying payments
- 25% application missing information
- 16% loans are not eligible (FFEL Program loans, Perkins loans and private student loans are not eligible, nor are loans in default)
- 2% issues involving employment dates (employment prior to October 2007 and employment prior to loan disbursement does not qualify)
- 2% employer not eligible
Some borrowers have alleged that FedLoan Servicing, the servicer with responsibility for PSLF, does not accurately count the number of qualifying payments. Other borrowers have alleged that their loan servicer mislead them about their eligibility for PSLF.
Some borrowers were in an incorrect repayment plan. Only income-driven repayment plans and standard repayment qualify for PSLF. In response to borrower complaints, Congress created the Temporary Expanded Public Service Loan Forgiveness (TEPSLF) program, funding it with $350 million from the Consolidated Appropriations Act of 2018 (P.L. 115-141). An additional $350 million in funding was provided by the Department of Defense and Labor, Health and Human Services, and Education Appropriations Act, 2019 and Continuing Appropriations Act, 2019.
To qualify for TEPSLF, the borrower’s application for PSLF must have been denied. The borrower must satisfy all of the other requirements for PSLF, such as having eligible loans, qualifying employment and 120 qualifying payments. However, borrowers can have been in other repayment plans, such as extended repayment and graduated repayment, so long as the most recent payment and the one 12 months prior are at least as much as would have been required under an income-driven repayment plan.
Of the 11,987 borrowers applying for TEPSLF, only 442 (3.7%) have been approved. A total of $17,557,594 has been forgiven, or an average of $39,723 per borrower.
The reasons for rejection include:
- 39% insufficient qualifying payments
- 21% do not satisfy TEPSLF requirements during the last 12 months
- 12% borrower has no eligible loans
Impact on the Next Generation
As the amount of debt at graduation grows, it will have a cascading effect on the next generation. Specifically, the percentage of college graduates with repayment terms of 20 or more years will have an impact on college enrollment of the next generation.
When current college graduates choose repayment terms of 20 or more years, it means that they will still be repaying their own student loans when their children enroll in college. This reduces the likelihood of their saving for their children’s education. It also affects their willingness to borrow to help their children pay for college.
There are several ways that a current college graduate can have a repayment term of 20 or more years.
- Extended repayment. There are two extended repayment plans. One requires consolidation and provides a repayment term of 20 or more years when the borrower has at least $20,000 in student loan debt. The other provides a repayment term of 25 years when the borrower has $30,000 or more in student loan debt.
- Graduated repayment. Similar repayment terms apply to borrowers in a graduated repayment plan, depending on the amount of debt.
- Income-driven repayment. Income-driven repayment plans provide a repayment term of 20 or 25 years.
This table shows the percentage of college graduates who have enough debt to qualify for an extended or graduated repayment term of 20 or more years. A third of current college graduates have enough debt that their children will have greater challenges affording a college education two decades from now.
Year |
Year + 20 |
% of Borrowers (All Undergraduate Students) |
% of Borrowers (Bachelor’s Degree Recipients) |
1996 |
2016 |
5.2% |
9.5% |
2000 |
2020 |
16.2% |
25.7% |
2004 |
2024 |
15.2% |
24.7% |
2008 |
2028 |
22.2% |
34.0% |
2012 |
2032 |
30.1% |
46.2% |
2016 |
2036 |
32.2% |
45.9% |


