
There is a total of $1.6 trillion in student loan debt outstanding, owed by 45.1 million borrowers, as of Q1 of 2019. Total outstanding student loan debt demonstrates linear growth and will reach $2.0 trillion by the end of 2023 or beginning of 2024 and $3.0 trillion by late 2037 or early 2038, if current trends continue.
Student loan debt exceeded credit card debt in 2010, auto loan debt in 2011 and reached the $1 trillion mark in 2012.
More than two-thirds of student loan debt is for undergraduate education. More than three-fifths of student loan debt is owed by women.
More than half of student loan debt was borrowed to pay for a public college education. About a third of student loan debt was borrowed to pay for a private non-profit college education. About one-sixth of student loan debt was borrowed to pay for a private for-profit college education.
Federal Reserve Board Statistics
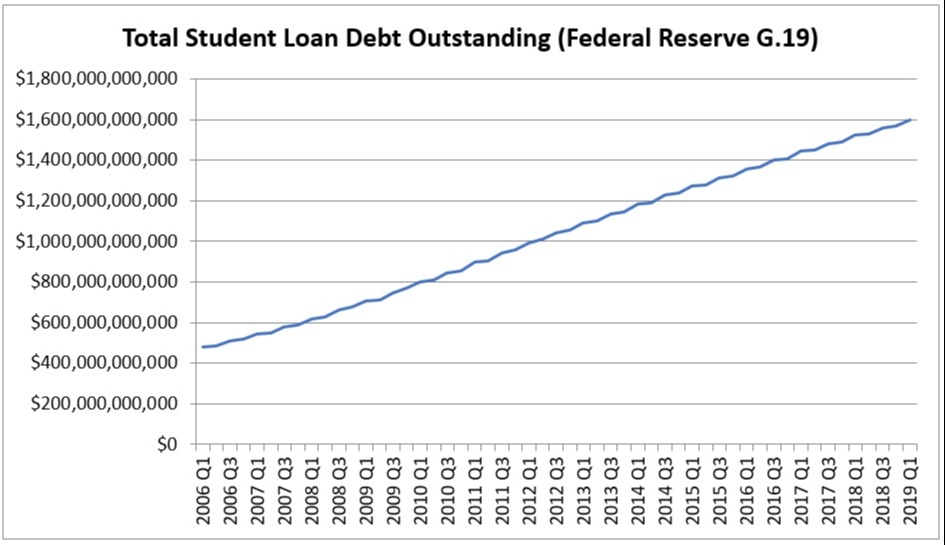
According to the Federal Reserve Board, total student loan debt outstanding reached $1.6 trillion ($1,598,505,520,000) as of Q1 of 2019. The Federal Reserve Board’s figure is based on data from the National Student Loan Data System (NSLDS) for federal student and parent loans, and MeasureOne for private student loans.
This chart shows how the outstanding student loan debt has changed since 2006. It’s very close to a straight line. Assuming the current trend continues, total student loan debt outstanding will reach $2 trillion in Q3 or Q4 of 2023 and $3 trillion by late 2037 or early 2038. Student loan debt outstanding is increasing by $2,361.30 per second.
Federal Reserve Bank of New York Reports Lower Student Debt Figures
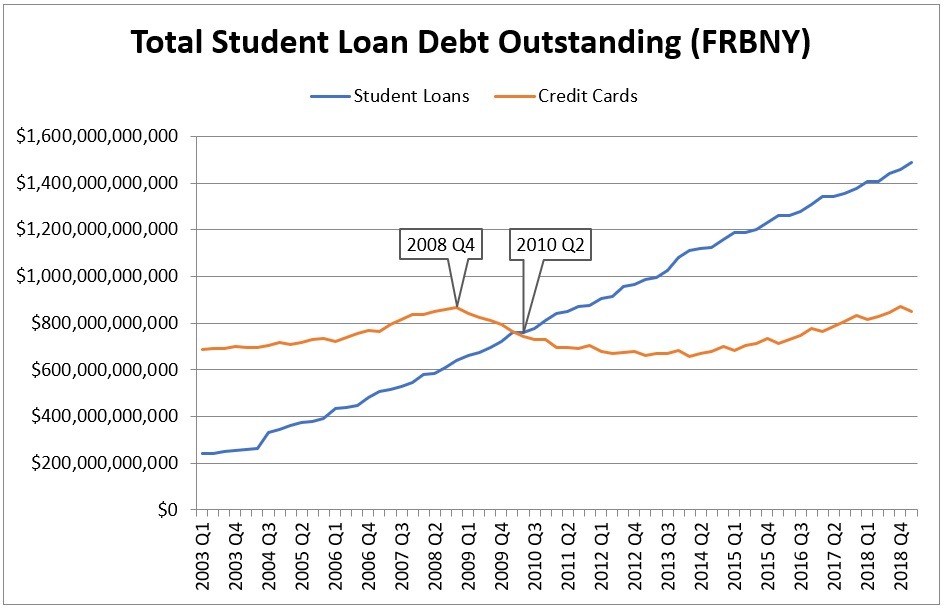
The Federal Reserve Bank of New York (FRBNY) reports a lower figure of $1.5 trillion ($1,486,000,000,000) for total outstanding student loan debt. The FRBNY figure is $112.5 billion lower than the figure reported by the Federal Reserve Board.
The FRBNY figure under-reports actual student loan debt outstanding because it is uses a consumer panel to sample credit bureau data. The consumer panel that has an age distribution that is a bit older than the age distribution of student loan borrowers. While this may work well for mortgages, auto loans and credit cards, it effectively is looking a year and a half into the past for student loans.
Comparing Student Loans with Other Types of Consumer Debt
Nevertheless, the FRBNY data provides for a comparison with other types of debt, such as the $9.244 trillion of mortgage debt, $1.28 billion of auto loan debt and $848 billion of credit card debt. Mortgage debt is close to the peak of $9.294 trillion that was reached in Q3 2008. The annual increase in student loan debt is much lower than the annual increase in mortgage debt, so student loan debt is extremely unlikely to ever catch up with mortgage debt.
This chart shows how credit card debt outstanding peaked in Q4 of 2008 and started decreasing, allowing student loan debt outstanding to exceed credit card debt outstanding for the first time in Q2 of 2010. This demonstrated that student loan debt is now a macroeconomic factor, albeit a weak one, with annual student loan payments accounting for 0.4% of GDP.
Federal Student Loan Data
According to the Federal Student Loan Portfolio Summary, which is based on NSLDS, total federal student loans outstanding, including Direct Loans, FFEL Program loans and Federal Perkins Loans, reached $1.4471 trillion and 43.0 million borrowers as of Q1 of FY2019 (December 31, 2018).
More than three quarters of the total, $1.1633 trillion, is in the Direct Loan program, with 34.5 million borrowers. $277.0 billion remains in the FFEL Program, with 13.1 million borrowers. 4.6 million borrowers have both FFEL Program and Direct Loans.
Estimating the Number of Borrowers
Based on historical data from 1996 to 2016, increasing the number of federal student loan borrowers by 4.85% yields the number of borrowers with federal and/or private student loans. Combining this with 43.0 million borrowers of federal student loans yields a total of 45.1 million borrowers with outstanding federal and/or private student loan debt as of the end of 2018.
Based on this figure, 13.7% of the U.S. population has student loan debt, as of Q1 of 2019.
Percentage Borrowed by Undergraduate Students
From 1995-96 through 2015-16, 69% of federal and private student loans was for undergraduate students and 31% for graduate and professional school students. The percentage of total student loans borrowed by undergraduate students is 64% for federal education loan disbursements and 82% for private student loan disbursements. Accordingly, it is reasonable to assume that 69% of outstanding student loan debt, or $1.1 trillion, was used to pay for an undergraduate education and about half a trillion for graduate and professional school.
Percentage Borrowed by Type of College
From 1995-96 through 2015-16, half (52%) of federal and private student loans was borrowed by students at public colleges, a third (33%) by students at private non-profit colleges, and one-sixth (16%) by students at private for-profit colleges. Thus, outstanding student loan debt includes $831 billion owed by students who attended public colleges, $527 billion owed by students who attended private non-profit colleges and $256 billion by students who attended private for-profit colleges. However, since students who attended private for-profit colleges are more likely to encounter financial difficulty, the amount of student loan debt outstanding owed by these students may be a bit higher.
Percentage Borrowed by Female Students
Women owe more student loan debt than men. From 1995-96 through 2015-16, 39% of federal and private student loans were borrowed by men and 61% by women. Accordingly, women likely owe at least $976 billion of the $1.6 trillion in student loan debt outstanding as of Q1 of 2019. If current trends continue, women will owe $1 trillion in student loan debt when the overall student loan debt outstanding reaches $1.639 trillion, which will occur on or about Halloween 2019.
Outstanding Student Loan Debt Milestones
Over the last decade, student loan debt outstanding has reached several milestones that have attracted the attention of news media and policymakers. Most of these milestones are based on total student loan debt, including federal and private student loan debt for undergraduate and graduate/professional students, as well as parent education loans.
- 2010: Federal and private student loan debt exceeds credit card debt for the first time
- 2011: Federal and private student loan debt exceeds auto loan debt for the first time
- 2012: Federal and private student loan debt reaches $1 trillion
- 2013: Federal student loan debt reaches $1 trillion on its own
- 2018: Federal and private student loan debt reaches $1.5 trillion
If the growth in student loan debt continues at the same rate, we should reach $2 trillion in total outstanding student loan debt in late 2023 or early 2024.
People pay attention to milestones, but the impact on individual borrowers matters more. Most borrowers can afford to repay their student loans in ten years or less if their total student loan debt is less than their annual income. Otherwise, they will struggle to repay their student loans and will need to reduce the monthly loan payment by stretching out the term of the loan through an extended or income-driven repayment plan.
Annual Student Loan Volume
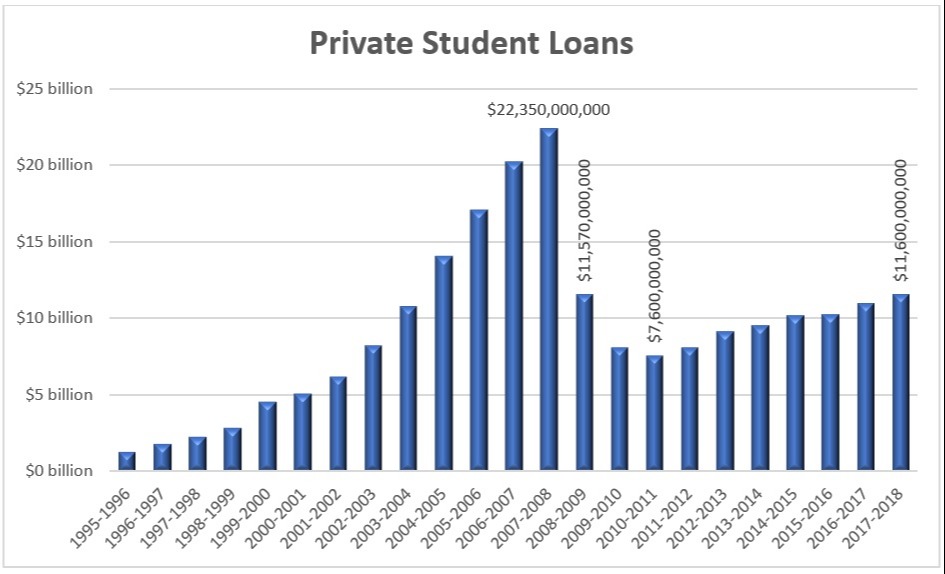
This chart shows annual private student loan disbursements, not adjusted for inflation.
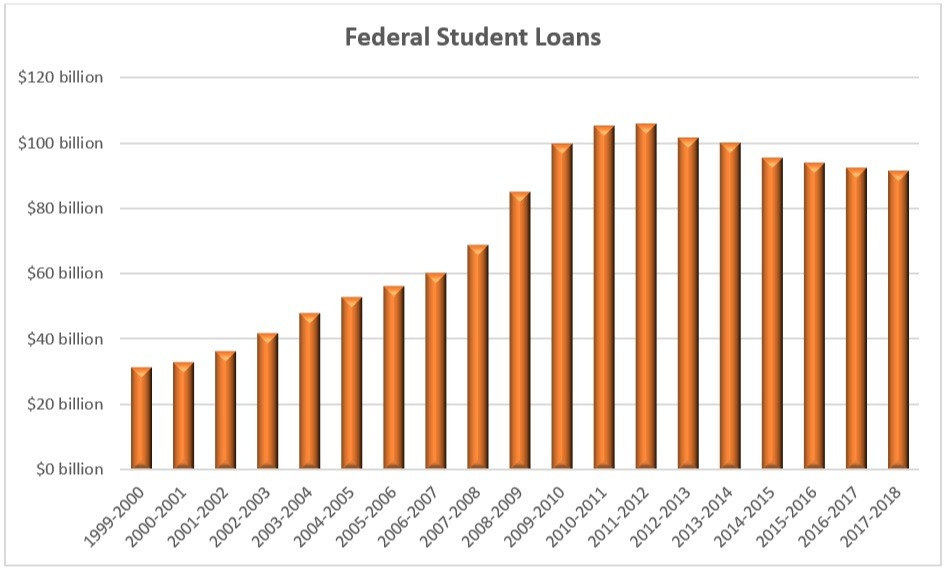
This chart shows annual federal student and parent loan disbursements, not adjusted for inflation.
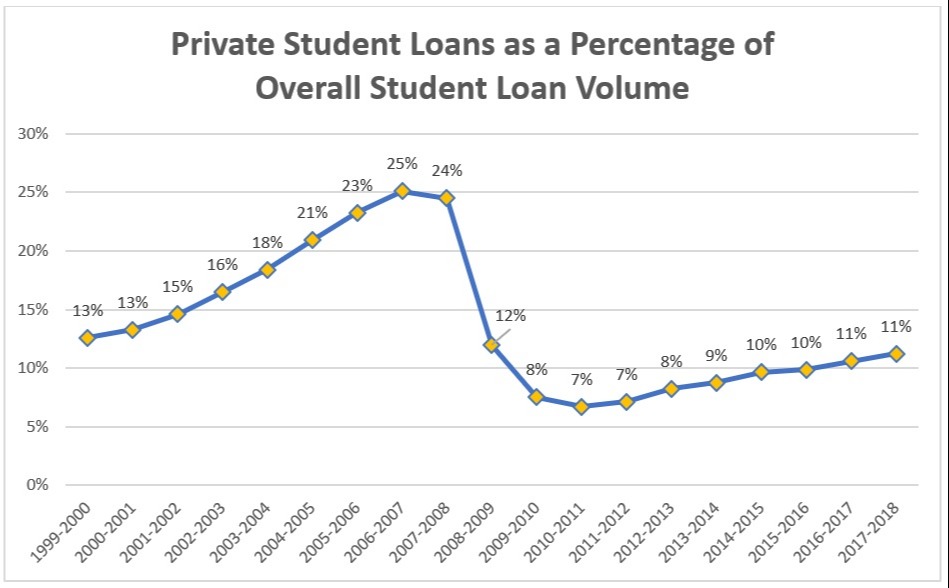
This chart shows the ratio of private student loan disbursements to total student loan disbursements, including federal student and parent loans. The percentage peaked at 25% in 2006-07, before the student loan credit crisis.
This table shows annual federal and private student loan disbursements, including parent loans, not adjusted for inflation.
Year |
Federal Student Loans |
Private Student Loans |
Total Student Loans |
2017-2018 |
$91,670,640,018 |
$11,600,000,000 |
$103,270,640,018 |
2016-2017 |
$92,653,026,442 |
$11,000,000,000 |
$103,653,026,442 |
2015-2016 |
$94,137,157,749 |
$10,300,000,000 |
$104,437,157,749 |
2014-2015 |
$95,584,812,099 |
$10,230,000,000 |
$105,814,812,099 |
2013-2014 |
$100,160,699,512 |
$9,590,000,000 |
$109,750,699,512 |
2012-2013 |
$101,719,853,921 |
$9,150,000,000 |
$110,869,853,921 |
2011-2012 |
$106,087,859,438 |
$8,150,000,000 |
$114,237,859,438 |
2010-2011 |
$105,343,518,023 |
$7,600,000,000 |
$112,943,518,023 |
2009-2010 |
$99,824,741,528 |
$8,100,000,000 |
$107,924,741,528 |
2008-2009 |
$85,279,308,917 |
$11,570,000,000 |
$96,849,308,917 |
2007-2008 |
$68,891,841,340 |
$22,350,000,000 |
$91,241,841,340 |
2006-2007 |
$60,335,198,802 |
$20,230,000,000 |
$80,565,198,802 |
2005-2006 |
$56,364,145,558 |
$17,090,000,000 |
$73,454,145,558 |
2004-2005 |
$53,115,729,625 |
$14,050,000,000 |
$67,165,729,625 |
2003-2004 |
$47,989,697,452 |
$10,820,000,000 |
$58,809,697,452 |
2002-2003 |
$41,872,392,524 |
$8,260,000,000 |
$50,132,392,524 |
2001-2002 |
$36,387,561,831 |
$6,220,000,000 |
$42,607,561,831 |
2000-2001 |
$33,175,915,539 |
$5,090,000,000 |
$38,265,915,539 |
1999-2000 |
$31,582,873,484 |
$4,560,000,000 |
$36,142,873,484 |


