
As borrowers grow older, they tend to make progress in repaying their student loan debt, to a point. The remaining borrowers are increasingly the ones who struggle to repay their student loans. Older borrowers are more likely to be in deferment, forbearance or default.
Student loan debt also varies by the type of college and the location of the college.
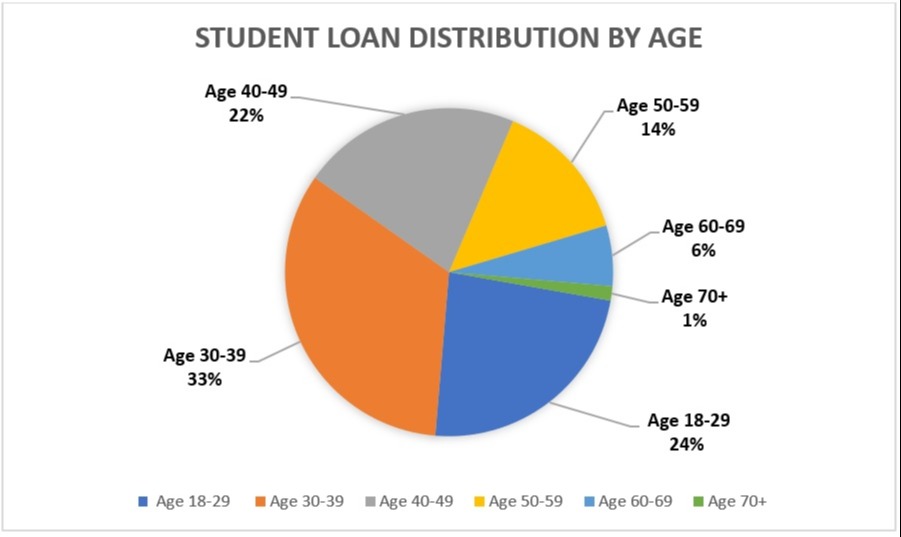
Student Loans by Borrower Age
This chart shows the distribution of student loan borrowers by borrower age, using data from the Household Debt and Credit Report from Q1 of 2019. Borrowers who are age 40 and older tend to have a smaller share of outstanding student loan debt, but also face more challenges repaying the debt.
This table shows the distribution of federal student loans outstanding in the Direct Loan portfolio by borrower age, using data from the FSA Data Center for Q1 of FY2019.
Age |
Dollars |
Borrowers |
24 and Younger |
8.3% |
18.4% |
25 to 34 |
34.0% |
33.3% |
35 to 49 |
37.7% |
30.9% |
50 to 61 |
15.4% |
12.9% |
62 and Older |
4.7% |
4.2% |
Student Loan Debt by Type of College
This table shows the distribution of federal student loans by type of college, based on data from the FSA Data Center in Q1 of FY2019.
Institution Type |
% of Dollars |
% of Borrowers |
Public |
42.6% |
42.4% |
Private Non-Profit |
33.0% |
23.0% |
Private For-Profit |
17.1% |
21.0% |
Foreign |
1.1% |
0.2% |
Other |
6.2% |
13.5% |
Student Loan Debt by Location
These tables show the number of borrowers in each state and the average amount owed. The data is based on the location of the college, not the borrower’s state of residence.
Note that the number of borrowers and average debt is influenced by the mix of college types (public vs. private) in the state, as opposed to overall college affordability for colleges located in the state. Also, the data does not reflect relocation of borrowers after graduation.
This table shows the distribution of federal student loans by location using data from the FSA Data Center in Q1 of FY2019.
Location |
# of Borrowers |
California |
3,791,200 |
Texas |
3,277,700 |
Florida |
2,404,000 |
New York |
2,373,900 |
Georgia |
1,516,900 |
Pennsylvania |
1,735,900 |
Ohio |
1,746,300 |
Illinois |
1,585,600 |
Michigan |
1,393,300 |
North Carolina |
1,194,700 |
Virginia |
1,020,700 |
New Jersey |
1,125,800 |
Maryland |
794,700 |
Massachusetts |
866,800 |
Tennessee |
803,900 |
Indiana |
880,000 |
Arizona |
818,500 |
Missouri |
805,200 |
Colorado |
736,100 |
Washington |
760,000 |
Minnesota |
775,900 |
South Carolina |
667,600 |
Wisconsin |
709,800 |
Alabama |
589,200 |
Louisiana |
597,800 |
Oregon |
528,400 |
Kentucky |
572,600 |
Connecticut |
462,900 |
Mississippi |
416,000 |
Oklahoma |
457,300 |
Iowa |
431,000 |
Kansas |
372,600 |
Arkansas |
363,100 |
Nevada |
314,900 |
Utah |
288,500 |
Puerto Rico |
316,400 |
Nebraska |
239,900 |
New Mexico |
218,300 |
West Virginia |
218,400 |
Idaho |
207,600 |
District of Columbia |
115,400 |
New Hampshire |
184,000 |
Maine |
177,700 |
Rhode Island |
134,600 |
Hawaii |
119,000 |
Delaware |
115,500 |
Montana |
119,700 |
South Dakota |
110,300 |
Vermont |
74,300 |
North Dakota |
82,300 |
Alaska |
66,000 |
Wyoming |
51,300 |
This table shows the average debt per borrower by location, using data from the FSA Data Center in Q1 of FY2019.
Location |
Average Debt per Borrower |
District of Columbia |
$51,993 |
Maryland |
$39,386 |
Georgia |
$38,697 |
Virginia |
$36,250 |
South Carolina |
$35,650 |
Florida |
$35,566 |
New York |
$35,090 |
Vermont |
$34,993 |
Illinois |
$34,939 |
North Carolina |
$34,904 |
Oregon |
$34,633 |
Colorado |
$34,506 |
Alabama |
$34,453 |
Mississippi |
$33,894 |
California |
$33,868 |
Tennessee |
$33,835 |
Delaware |
$33,766 |
Hawaii |
$33,613 |
Michigan |
$33,374 |
Missouri |
$33,035 |
Pennsylvania |
$33,009 |
Arizona |
$32,987 |
Washington |
$32,632 |
New Jersey |
$32,421 |
Ohio |
$32,354 |
Connecticut |
$32,188 |
Louisiana |
$31,950 |
Alaska |
$31,818 |
Massachusetts |
$31,726 |
New Mexico |
$31,608 |
New Hampshire |
$31,522 |
Nevada |
$31,439 |
Minnesota |
$31,190 |
Montana |
$30,911 |
Arkansas |
$30,845 |
Indiana |
$30,795 |
Texas |
$30,692 |
Maine |
$30,388 |
Kentucky |
$30,388 |
Idaho |
$30,347 |
Kansas |
$30,327 |
Utah |
$30,156 |
West Virginia |
$29,762 |
Wisconsin |
$29,727 |
Rhode Island |
$29,718 |
Nebraska |
$29,596 |
Oklahoma |
$29,521 |
Wyoming |
$29,240 |
South Dakota |
$29,012 |
Iowa |
$28,306 |
North Dakota |
$26,731 |
Puerto Rico |
$23,704 |


