
 {{parent.title}}
 Login
Login

Despite increases in the percentage of undergraduate students filing the Free Application for Federal Student Aid (FAFSA) each year, millions of students who would have qualified for college grants still fail to file the FAFSA.
More than 2 million students would have qualified for the Federal Pell Grant in 2015-2016, if they had only filed the FAFSA. Of them, 1.2 million would have qualified for the maximum Federal Pell Grant. Of the students who did not file the FAFSA, more than a third would have qualified for the Federal Pell Grant.
Growth in the percentage of undergraduate students filing the FAFSA
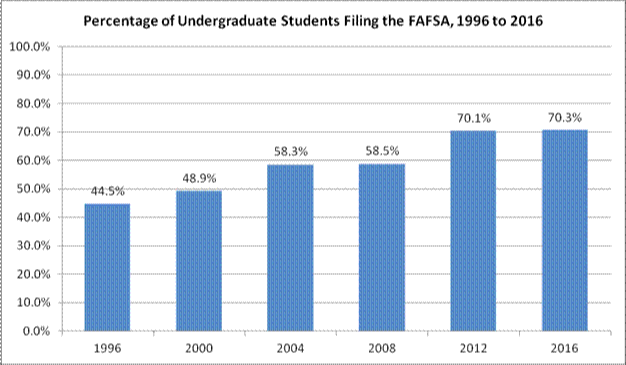
As shown in this chart, the percentage of undergraduate students filing the FAFSA has increased from 44.5% in 1996 to 70.3% in 2016, based on data from the National Postsecondary Student Aid Study (NPSAS).
However, the majority of the increase has been middle and high income students, who are less likely to qualify for the Federal Pell Grant. Of the increase in the number of undergraduate students filing the FAFSA, a third (33%) were in the bottom half by income as a percent of the poverty line, while two thirds were in the top half (67%).
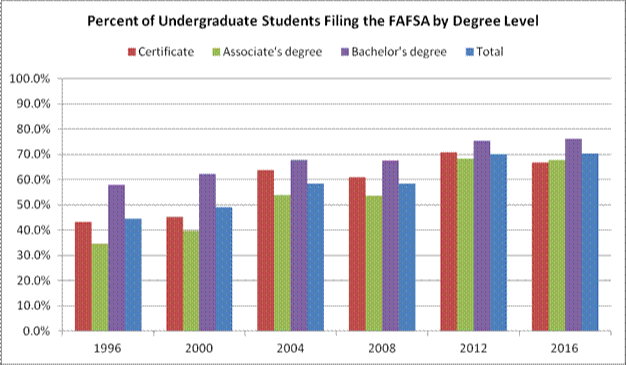
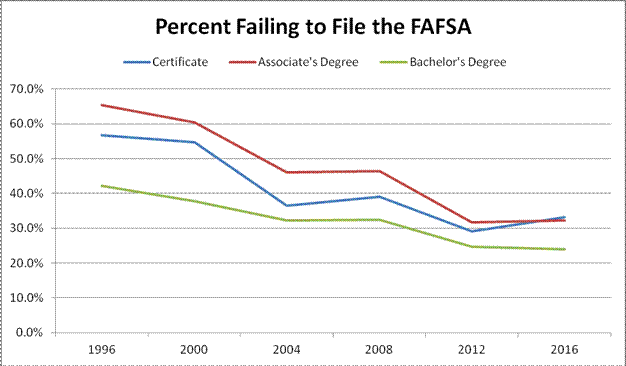
This chart shows fairly consistent growth in the percentage of undergraduate students filing the FAFSA when disaggregated by degree level. Students in Bachelor’s degree programs are more likely to file the FAFSA than students in Associate’s degree and Certificate programs.
Estimating Pell Grant eligibility of non-applicants
A new, more precise method is used to estimate the number of undergraduate students who didn’t file the FAFSA but would have qualified for a Federal Pell Grant.
The expected family contribution (EFC) of non-filers is imputed based on income for dependent students, independent students without dependents other than a spouse, and independent students with dependents other than a spouse. Student, spouse and parent assets are ignored because the data is not available.
The imputed EFC is compared with the eligibility cutoff for a Federal Pell Grant, which is 90% of the maximum Federal Pell Grant. If the imputed EFC is zero, the student is assumed to qualify for the maximum Federal Pell Grant.
In addition, the number of students who might qualify for a Federal Pell Grant is reduced by filtering the student population by general eligibility criteria for federal student aid, including citizenship (U.S. citizen or eligible non-citizen, excluding international students), GPA (must be at least a 2.0 on a 4.0 scale) and degree program (must be seeking a degree or certificate).
The number of Pell-eligible non-applicants grows
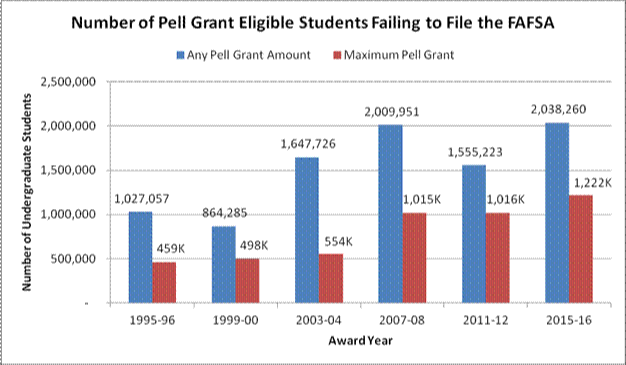
As shown in this chart, the number of undergraduate students who would have been eligible for the Federal Pell Grant if they had only filed the FAFSA nearly doubled from 1.03 million in 1995-96 to 2.04 million in 2015-16. The number who would have qualified for the maximum Federal Pell Grant increased from 459,000 to 1.2 million. Millions of students fail to file the FAFSA each year. This is unfortunate, because you can’t get aid if you don’t apply.
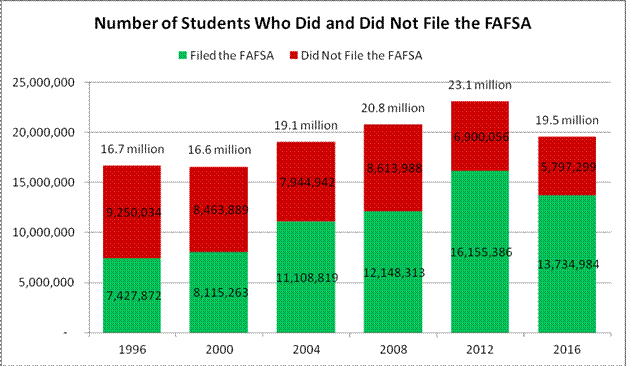
To set this in context, this chart shows the number of students who did and did not file the FAFSA. The blue line in the previous chart is a subset of the red line in this chart. The numbers above each bar are the total number of undergraduate students.
The number of Pell-eligible undergraduate students who did not file the FAFSA has increased as a percentage of students who did not file the FAFSA, as shown in this chart.
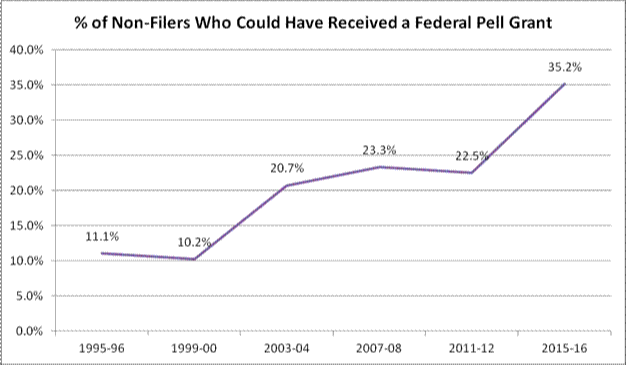
This table provides additional detail concerning undergraduate students who did not file the FAFSA but could have qualified for a Federal Pell Grant.
Year |
Number |
Number Eligible |
Total Number |
% of Non-Filers |
1995-96 |
1,027,057 |
458,843 |
9,250,034 |
11.1% |
1999-00 |
864,285 |
497,872 |
8,463,889 |
10.2% |
2003-04 |
1,647,726 |
554,290 |
7,944,942 |
20.7% |
2007-08 |
2,009,951 |
1,014,597 |
8,613,988 |
23.3% |
2011-12 |
1,555,223 |
1,015,866 |
6,900,056 |
22.5% |
2015-16 |
2,038,260 |
1,222,048 |
5,797,299 |
35.2% |
How much financial aid is lost?
Undergraduate students who do not file the FAFSA are missing out on more than $10 billion in grants and other gift aid.
- $9.5 billion in Federal Pell Grants. This estimate is based on an average Federal Pell Grant of $2,983 for students with a non-zero EFC and a maximum Federal Pell Grant of $5,775 for students with a zero EFC in 2015-16.
- $1.2 billion in state grants. This estimate is based on an average state grant of $605, averaged among all students, including non-recipients.
- $1.5 billion in institutional grants. This estimate is based on an average institutional grant of $722, averaged among all students, including non-recipients.
- $180 million in Federal Supplemental Educational Opportunity Grants (FSEOG). This estimate is based on an average FSEOG of $88, averaged among all students, including non-recipients.
Why do some students fail to file the FAFSA?
The National Postsecondary Student Aid Study (NPSAS) asks students who did not file the FAFSA the reason why they did not file the FAFSA. This table shows the reasons given by students who would have qualified for a Federal Pell Grant. The percentages may sum to more than 100% because the students could choose more than one answer.
Reason |
2011-12 |
2015-16 |
Thought ineligible for aid |
46.2% |
49.5% |
Had no need |
35.0% |
42.6% |
Did not want to take on debt |
34.1% |
32.2% |
Had no information on how to apply for financial aid |
13.4% |
14.1% |
Financial aid application forms were too much work |
9.7% |
9.5% |
But, it is unclear why these students thought that they had no financial need and were ineligible for financial aid. There has been no follow-up study of these students. The first three reasons cover 96% of the non-applicants.
Perhaps these students believe they have no need and are ineligible for financial aid because they are attending low-cost institutions or are working their way through college?
Further analysis uncovers the following prevalence statistics about Pell-eligible non-filers in 2015-2016:
- Four-fifths (81.7%) are low-income students, with an adjusted gross income (AGI) less than $50,000. 16.7% have an AGI of $50,000 to $99,999 and 1.7% have an AGI of $100,000 or more.
- Three quarters (77.6%) are independent students.
- Two-thirds (62.3%) are just a year or two away from obtaining a Bachelor’s degree.
- More than half (58.9%) are enrolled mostly part-time.
- More than half (53.0%) are enrolled in a community college.
- A third (33.1%) work a full-time job of 40 or more hours a week.
The following statistics show the likelihood of undergraduate students with a Pell-eligible EFC, U.S. citizen or eligible non-citizen, 2.0 or better GPA and enrollment in a degree or certificate program to fail to file the FAFSA in 2015-2016:
- 22.1% of low-income students, 28.3% of middle-income students and 73.2% of high-income students
- 11.7% of dependent students and 26.6% of independent students (30.0% of unmarried independent students without dependents, 20.8% of married independent students without dependents and 24.7% of independent students with dependents)
- 31.6% of students enrolled mostly part-time and 13.7% of students enrolled mostly full-time
- 17.7% of students enrolled in public 4-year colleges, 27.9% of students enrolled in community colleges, 37.7% of students enrolled in public less-than-2-year institutions compared with 9.9% of students enrolled in for-profit 4-year colleges, 8.4% of students enrolled in for-profit 2-year colleges and 12.2% of students enrolled in for-profit less-than-2-year institutions
- 23.4% of students enrolled in public colleges, 17.1% of students in non-profit colleges and 10.0% of students enrolled in for-profit colleges
- 25.0% of students enrolled in Certificate programs, 23.8% of students enrolled in Associate’s degree programs and 16.3% of students enrolled in Bachelor’s degree programs
- 23.8% of students who work 40 or more hours a week, compared with 17.7% of students who work 12 hours or less a week
Improvements are possible
As this chart demonstrates, the percentage of students failing to file the FAFSA has decreased significantly from 1996 to 2016, dropping almost in half. For example, the percentage of students in Bachelor’s degree programs who fail to file the FAFSA dropped from 42% in 1996 to 24% in 2016. For students in Associate’s degree programs, the percentage dropped from 65% to 32%, and for students in Certificate programs, the percentage dropped from 57% to 33%.
More noteworthy is that the percentage of students who fail to file the FAFSA has hovered around 10% at for-profit colleges and was less than 10% in 2008, as shown in this chart. The percentage of students failing to file the FAFSA at 2-year for-profit colleges was only 4.5% in 2008. That’s much better than the more than half (56.5%) of community college students who fail to file the FAFSA.
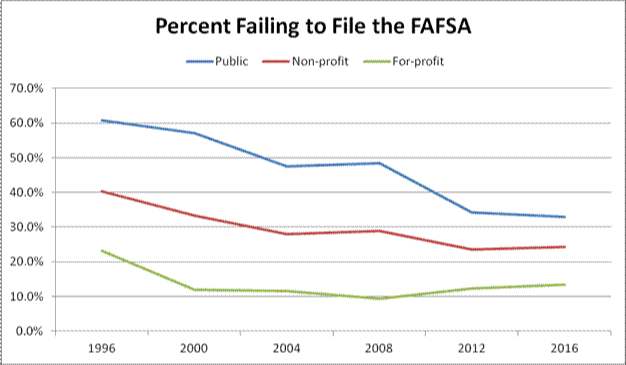
Given that a specific sector, 2-year for-profit colleges, is able to have a FAFSA completion rate greater than 95%, it seems that all colleges should be able to achieve much better FAFSA completion rates than they currently do.
Recommendations
High schools and colleges could significantly increase the number of students filing the FAFSA by helping students and families complete the form through programs like College Goal Sunday (Form Your Future).
Simplifying the FAFSA by reducing the number of questions would also help.
Another solution would involve requiring students to complete a FAFSA for high school graduation and/or college admission.
FAFSA completion can also be incentivized by providing prizes to applicants. After all, if people spend money to buy scratch off cards and lottery tickets, they might be willing to file the FAFSA for free for a chance at cash prizes and a free ride to college. A promotion that presents the Federal Pell Grant as a chance to win up to $6,095 a year for college and the FAFSA as a free ticket to enter might be effective.


