Each year, more than 1.7 million private scholarships and fellowships are awarded, with a total value of more than $7.4 billion.
Scholarships and fellowships are a form of gift aid, which is financial aid that does not need to be repaid or earned. Private scholarships are independent, non-college-controlled gift aid, often funded by foundations, corporations and philanthropists.
Scholarships are typically awarded to undergraduate students and fellowships are typically awarded to graduate and professional school students.
This article provides information about scholarships statistics. A different article provides information about student loan statistics.
Did you know that scholarships are taxable? Use our Scholarship Tax Calculator to figure out the taxable amount of your scholarships and calculate how much you’ll have to pay in taxes. Amounts used to pay for tuition and textbooks may be tax-free, but amounts used to pay for living expenses are taxable.
Number and Amount of Scholarships
This table shows the number of scholarships and total amount of scholarships awarded to all undergraduate students. It also reports the average scholarship amount per recipient and the percentage of undergraduate students using scholarships to pay for college.
Academic Year |
Number of Scholarships |
Total Amount of Scholarships |
Average Scholarship |
Percentage with Scholarships |
1989-1990 |
526,000 |
$695 million |
$1,321 |
3.2% |
1992-1993 |
639,000 |
$920 million |
$1,441 |
3.5% |
1995-1996 |
594,300 |
$920 million |
$1,547 |
3.6% |
1999-2000 |
1,397,000 |
$2.9 billion |
$2,065 |
8.4% |
2003-2004 |
1,289,900 |
$2.5 billion |
$1,961 |
6.8% |
2007-2008 |
1,092,400 |
$2.7 billion |
$2,509 |
5.3% |
2011-2012 |
1,811,500 |
$6.2 billion |
$3,431 |
7.9% |
2015-2016 |
1,581,000 |
$6.1 billion |
$3,852 |
8.1% |
This table shows the data for 2015-16, broken down by undergraduate degree level.
Academic Degree Level |
Number of Scholarships |
Total Amount of Scholarships |
Average Scholarship |
Percentage with Scholarships |
Certificate |
54,300 |
$157,531,788 |
$2,901 |
3.1% |
Associate’s Degree |
352,300 |
$992,896,990 |
$2,818 |
4.4% |
Bachelor’s Degree |
1,154,300 |
$4,850,366,291 |
$4,202 |
12.7% |
There are more than a dozen free scholarship search sites that will match a student’s background against a database of scholarships. The typical high school senior will match 50 to 100 such scholarships, depending, in part, on whether they answer the optional questions in addition to the required questions.
Odds of Winning a Scholarship
The raw odds of winning a scholarship are about 1 in 8 for a student in a Bachelor’s degree program.
Very few of these students will win a “free ride.” Of students in Bachelor’s degree programs in 2015-16, only 1.5% got enough scholarships and grants to cover 100% of the cost of attendance.
2.7% got enough to cover 90% of the cost of attendance, 5.9% got enough to cover three quarters of the cost of attendance, and 18.8% got enough to cover half of the cost of attendance.
Of all undergraduate students, only 0.1% got $25,000 or more in scholarships. 97% of scholarship recipients receive $2,500 or less in scholarships.
Number and Amount of Fellowships
This table shows the number of fellowships and total amount of fellowships awarded to all graduate and professional school students. It also reports the average fellowship amount per recipient and the percentage of graduate and professional school students using fellowship to pay for college.
Academic Year |
Number of Fellowships |
Total Amount of Fellowships |
Average Fellowship |
Percentage with Fellowships |
1995-1996 |
66,300 |
$218 million |
$3,291 |
2.4% |
1999-2000 |
158,600 |
$623 million |
$3,927 |
6.0% |
2003-2004 |
157,800 |
$573 million |
$3,629 |
5.6% |
2007-2008 |
124,500 |
$716 million |
$5,752 |
3.6% |
2011-2012 |
199,000 |
$1.38 billion |
$6,930 |
5.4% |
2015-2016 |
189,500 |
$1.28 billion |
$6,752 |
5.3% |
Graduate and professional school students are less likely to receive fellowships than undergraduate students, but the average amount received is greater.
Characteristics of Scholarship Recipients
The odds of a student winning a scholarship vary according to student characteristics, such as grades, test scores, field of study and race.
Grades: Students with a 3.5 to 4.0 unweighted GPA are twice as likely to win a private scholarship as students with less than a 3.0 GPA. 17.0% of students with a 3.5 or higher GPA win private scholarships, compared with 13.1% of students with a 3.0 to 3.4 GPA, 10.4% of students with a 2.5 to 2.9 GPA, 8.3% of students with a 2.0 to 2.4 GPA, and 7.0% of students with less than a 2.0 GPA. So, even though most scholarships do not consider a student’s GPA, there is a strong correlation between academic performance and odds of winning a scholarship.
Test Scores: Students with above-average SAT and ACT test scores are more likely to win private scholarships. 12.9% of students with a SAT score of 1,000 or more win private scholarships, compared with 7.8% of students with a SAT score under 1,000. 12.4% of students with an ACT score of 21 or higher win private scholarships, compared with 7.7% of students with an ACT score under 21.
Field of Study: 16.2% of students majoring in STEM (science, technology, engineering and mathematics) win private scholarships, compared 11.5% of students pursuing non-STEM fields.
Race: White students are more likely to win a scholarship than minority students, 13.8% vs. 11.2%. Among students in Bachelor’s degree programs, nearly two-thirds (62.3%) are White, 11.8% are Black or African-American, 13.6% are Hispanic or Latino, 6.1% are Asian, 1.6% are American Indian or Alaska Native, 0.3% are Native Hawaiian or Other Pacific Islander, and 4.3% are more than one race.
Impact of Scholarships on College Affordability
Although correlations do not prove causation, a dose-response relationship, where outcomes improve with increases in the amount of private scholarships, is suggestive of causation. If the dose-response relationship is initially flat, that may be a sign of a dependency on having a critical mass of scholarships relative to costs.
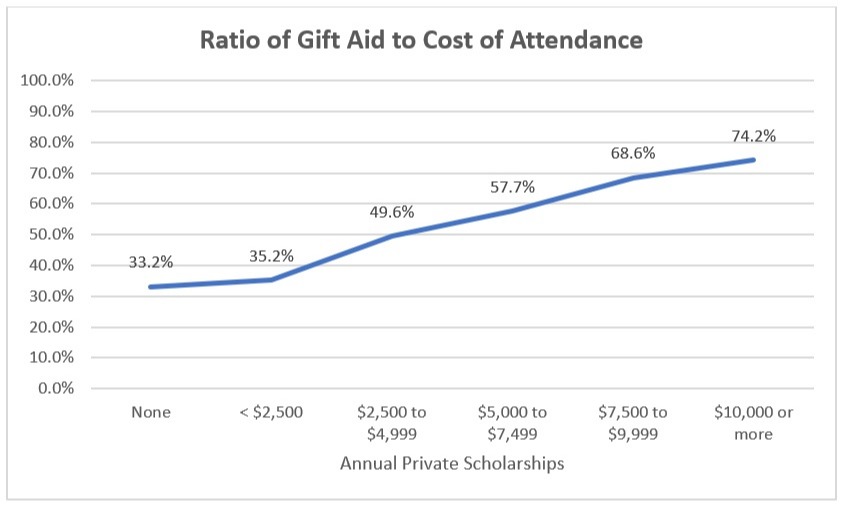
When a student wins a private scholarship, their gift aid covers a greater share of the cost of attendance.

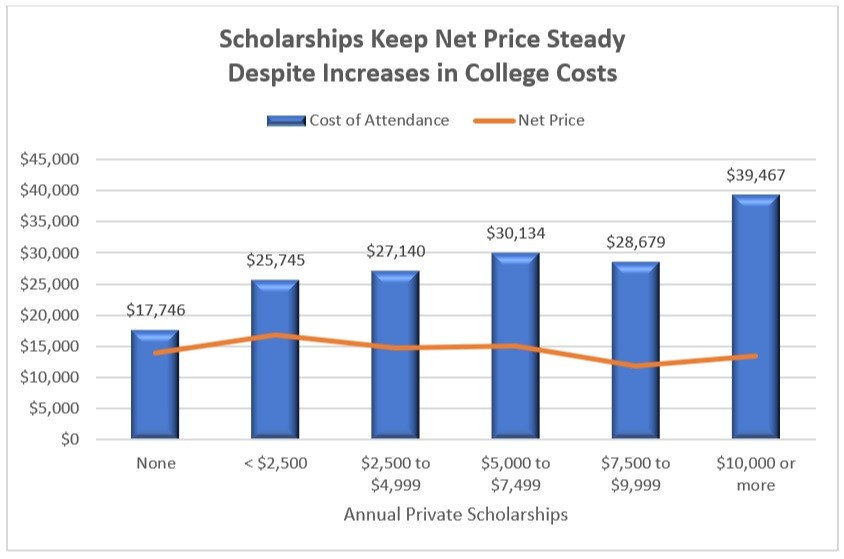
The net price is the difference between the cost of attendance and gift aid. It is the real cost of college, the amount the family must pay from savings, income and loans. This chart shows that the net price remains unchanged regardless of the amount of scholarships, an indication that private scholarships allow recipients to buy up to a more expensive college than they otherwise could afford.

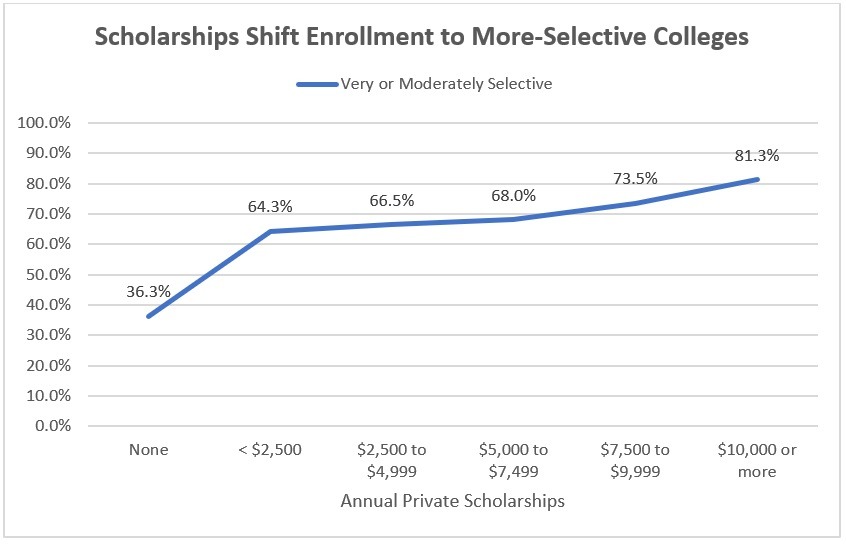
Receipt of private scholarships causes students to shift their enrollment patterns to more-selective colleges. About two-thirds (67%) of students with private scholarships enroll at very or moderately selective colleges, compared with more than a third (36%) of students who do not have private scholarships.

This table shows other ways in which scholarship recipients “buy up” to a better college. Scholarship recipients are more likely to enroll full-time, more likely to enroll at a 4-year college, more likely to pursue a Bachelor’s degree, more likely to enroll at a private non-profit college, and more likely to enroll at an out-of-state college.
Private Scholarships |
Percent 4-Year |
Percent Bachelor’s |
Percent Private Non-Profit |
Percent Out-of-State |
Percent Full-Time |
None |
54% |
44% |
15% |
15% |
49% |
Some |
78% |
73% |
27% |
18% |
81% |
Receipt of private scholarships also has an impact on outcomes, as shown in this table. The graduation rates are Bachelor’s degree attainment rates for students enrolled in a Bachelor’s degree program. Curiously, the difference in Bachelor’s degree attainment rates is about 15% for 4, 5 and 6 years.
Private Scholarships |
4-Year Grad Rate |
5-Year Grad Rate |
6-Year Grad Rate |
Applied to Grad School |
None |
30.3% |
49.5% |
59.7% |
26.0% |
Some |
45.1% |
64.6% |
74.4% |
28.3% |
Methodology
The data in this report is based on the National Postsecondary Student Aid Study (NPSAS), a large quadrennial study of how students paid for their college education. The most recent NPSAS, the 2015-16 NPSAS, surveyed 89,000 undergraduate students and 24,000 graduate students.


