
 {{parent.title}}
 Login
Login

Measuring the risk of age-based investment glide paths and target date funds is challenging because they consist of a series of portfolios, as opposed to a single static portfolio. With a static portfolio, the risk is the percentage of the portfolio’s assets that are invested in equities (e.g., stocks). This white paper defines the risk of an investment glide path as the average of the initial and final percentage equities.
Risk Based on Percentage Equities
The investment risk of a static portfolio can be defined as the percentage equities, which is the percentage of a portfolio’s assets that are invested in stocks and other equities.
A static portfolio is a mix of high-risk assets, such as equities, and low-risk assets, such as cash, mutual funds and bonds. Most of the performance of a diversified portfolio can be attributed to the asset allocation, as opposed to the individual investments within each asset class.
A portfolio with a higher percentage of its assets invested in equities yields greater investment returns, but also involves a higher risk of investment losses. A portfolio with a lower percentage of its assets invested in equities reduces the risk of losses, but also yields a lower return on investment.
Thus, the risk of a static portfolio correlates with the percentage equities of the portfolio.
Risk of an Investment Glide Path
How to evaluate the risk of an investment glide path is less straightforward, since an investment glide path consists of more than just one static portfolio.
Instead, an age-based investment glide path consists of a dynamic set of portfolios that change the percentage equity over time.
A target date fund is similar. Instead of moving an investment among a series of portfolios, a target date fund changes the set of investments in a single portfolio over time.
The net effect is the same, namely an investment that changes its asset allocation at specified intervals. The difference is in how the intervals are specified, whether by the age of the beneficiary, the number of years remaining until college matriculation, or a predefined set of fixed intervals.
Thus, an age-based investment glide path or a target date fund is the equivalent of a set of portfolios that change the percentage equity over time.
Therefore, risk of an age-based investment glide path is a function of the risk of an ordered set of portfolios.
This risk function can be decomposed into three independent components:
- Start. This is the percentage equity of the initial portfolio of the glide path.
- End. This is the percentage equity of the final portfolio of the glide path.
- Middle. This is the percentage equities of the interior of the glide path.
Trivalent Measurement of Risk
Of the 180 age-based investment glide paths for 85 college savings plans, about a third do not label the glide paths according to risk. These are mostly in 529 college savings plans that have a single age-based investment glide path.
The rest assign age-based asset allocations to one of three risk labels: aggressive, moderate and conservative. A few use the label “growth” instead of “aggressive” while still using the “moderate” and “conservative” labels. This is a trivalent system for providing the consumer with three risk levels when choosing an age-based asset allocation.
There is no consistency among the various 529 plans in the labeling of age-based investment glide paths according to risk, perhaps because there are no standard definitions of what it means for a glide path to be aggressive, moderate or conservative. A glide path that is labeled as moderate by one 529 plan might be labeled as aggressive or as conservative by another 529 plan.
For example, the initial percentage equity varies from 80% to 100% for plans labeled aggressive, from 60% to 100% for plans labeled moderate and from 40% to 80% for plans labeled conservative. The final percentage equity at age 17 varies from 0% to 60% for plans labeled aggressive, 0% to 30% for plans labeled moderate and 0% to 40% for plans labeled conservative. Thus, a glide path with an initial percentage equity of 80% and a final percentage equity of 20% could be labeled as aggressive, moderate or conservative, depending on the 529 plan.
529 plans can also differentiate among age-based investment glide paths according to whether the portfolios involve active management or are passive index funds. Some also differentiate according to whether the portfolios are based on a specific fund family or multi-firm funds.
Impact of Initial and Final Percentage Equity
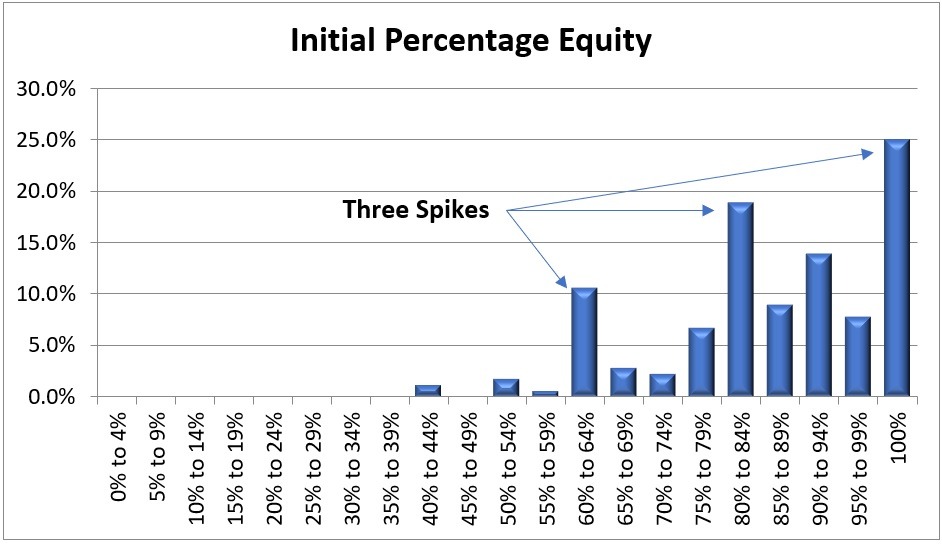
There does appear to be some differentiation among the glide paths according to initial percentage equity and less so according to final percentage equity.
This chart shows the distribution of the initial percentage equity among all 180 age-based investment glide paths for 85 college savings plans. As indicated, there are three definite spikes in the distribution, at about 60%, 80% and 100% percentage equity.
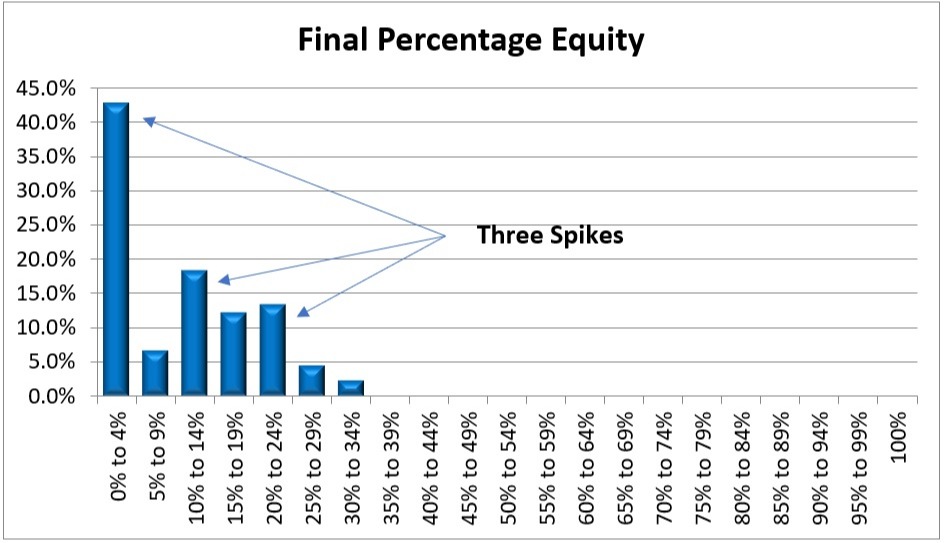
This chart shows the distribution of the final percentage equity among the age-based investment glide paths. As indicated, there appear to be three spikes in the distribution, at about 0%, 10% and 20% percentage equity, although the last two spikes are less definite due to overlap in the distribution.
If one calculates the average initial and final percentage equities for the age-based investment glide paths according to the risk labeling, the final percentage equities do not differentiate the glide paths, as shown in this table of the average percentage equity through age 17 for the 113 age-based investment glide paths with risk labels.
Risk Label |
Initial Percentage Equity |
Final Percentage Equity |
Conservative |
61% |
6% |
Moderate |
82% |
12% |
Aggressive |
96% |
10% |
As discussed previously in a paper about the impact of delayed onset of an age-based asset allocation on overall risk, sustaining a higher percentage equity at the start of an investment glide path does not significantly affect the overall risk. This is due in part to lower aggregate savings at the start of a glide path and in part due to the availability of a long investment horizon with which to recover from any losses.
In the aftermath of the 2008 decline in stock market performance, 529 plans may have become more risk-averse, choosing to have a final percentage equity at or under 20%. More than 90% of the age-based investment glide paths have a final percentage equity of 20% or less.
Impact of Glide Path Curvature
The curvature of a glide path measures how the interior of the glide path contributes to the risk and return of the portfolio. The curvature is defined as the average variance of the glide path from the linear glide path with the same start and finish.
This chart shows how a concave glide path varies from a linear glide path.
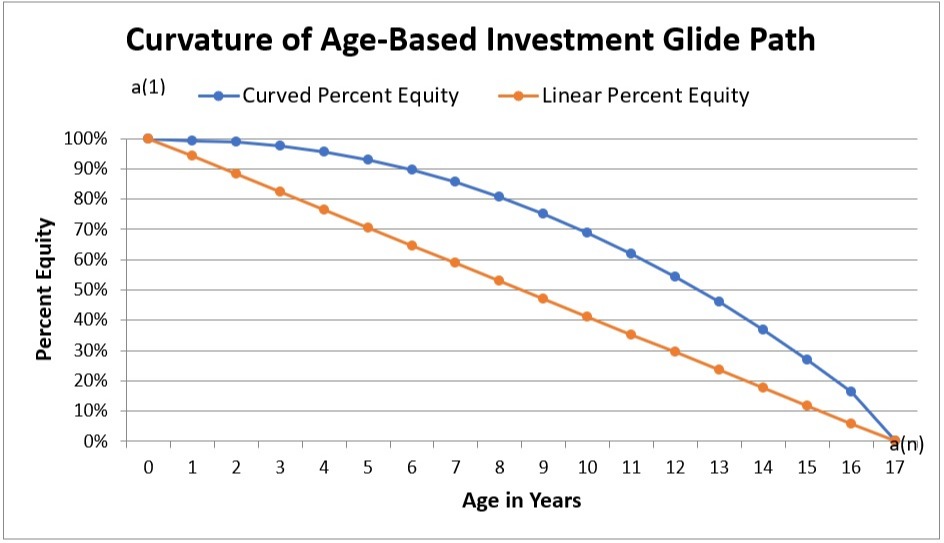
The curvature is the difference between the average percentage equity across all of the waypoints in the glide path and the average of the initial and final percentage equity for the glide path.
As shown in this chart, the bulk of the distribution of curvature in the 180 age-based investment glide paths ranges from -5% to +5%.
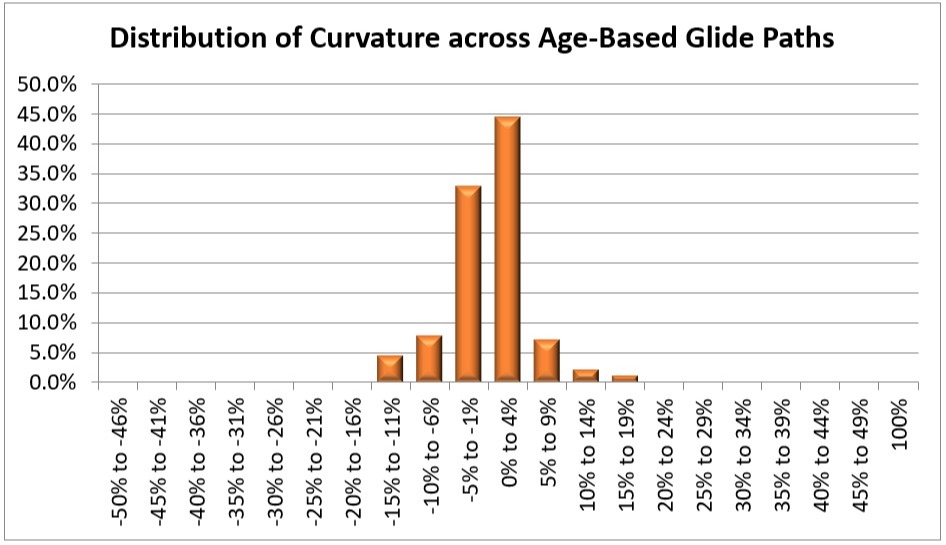
The curvature does not vary by much, regardless of the risk category. The average curvature is 2% for conservative, 7% for moderate and 10% for aggressive investment glide paths. These figures are about 15% of the average of the initial and final percentage equity.
Basing the Risk of a Glide Path on Initial and Final Percentage Equity
Since the curvature does not vary by much compared with the average of the initial and final percentage equity, we can safely ignore it when assessing risk of the glide path. Instead, we can rely on just the average of the initial and final percentage equity for measuring the risk of an age-based investment glide path.
Thus, the risk of a glide path can be defined as the average of the initial and final percentage equity.
This design decision may need to be re-evaluated in the future if 529 plans start introducing glide paths with greater curvature. This could occur if 529 plans start adopting delayed onset of age-based investment glide paths. It could also occur if 529 plans start intentionally manipulating the curvature of the glide path to yield a higher return for the same initial and final percentage equity.
Such a situation can be identified by tracking the curvature of the glide paths. If the curvature starts exceeding 15% of the average of the initial and final percentage equity, the solution will be to substitute the average of the percentage equity at every waypoint along the glidepath as the measure of risk. This is the equivalent of adding the curvature of the glide path to the average of the initial and final percentage equity.
Comparison with 529 Plan Labeling
When comparing various options for measuring the risk of an investment glide path, the final percentage equity correlated the least with existing 529 plan labeling, perhaps because the 529 plans intentionally bottom out at low risk even if they start off at high risk.
The other three options – initial percentage equity, average of initial and final percentage equity, and average of percentage equity at all waypoints – had a similar level of correlation with existing labeling.
This is not surprising because the average of the initial and final percentage equity and the average of the percentage equity at all waypoints yielded similar risk assessments for 82% of the age-based investment glide paths. The initial percentage equity and the average of the initial and final percentage equity yielded similar risk assessments for 63% of the glide paths.
Thus, it seems reasonable to base the risk assessments on the average of the initial and final percentage equity.
Consequences of Standardization
The risk assessments will differ from the current labeling of age-based investment glide paths for some of the 529 plans. Some 529 plans with multiple age-based investment glide paths may end up with some of their glide paths assigned to the same risk category despite different labeling of risk by the 529 plan.
These issues are due to the inconsistency among the way various 529 plans assigned risk labels to their age-based investment glide paths. Any attempt to standardize the risk assessment of age-based investment glide paths will encounter the same issue.
There are two approaches to addressing this.
- Disclose the full details of the new standard methodology for assigning risk categories to glide paths, so that it is clear that the methodology is objective and reasonable. That is the purpose of this white paper.
- Use different terminology for referring to the risk categorization. For example, instead of using the terms aggressive, moderate and conservative, one solution is to refer to the risk categories as low, medium and high.
New Standardized Measure of Glide Path Risk
If the initial and final percentage equity are normalized, this yields the averages show in this table.
Risk Label |
Initial Percentage Equity |
Final Percentage Equity |
Average of Initial and Final Percentage Equity |
Low |
60% |
10% |
35% |
Medium |
80% |
20% |
50% |
High |
100% |
30% |
65% |
These centroids are close to those of the mean data for all 180 age-based investment glide paths, namely 33%, 50% and 67%.
To assign a glide path to the corresponding risk label, pick the category with the closest average initial and final percentage equity.
This process can be simplified by picking a set of ranges for each risk label, based on the cut points midway between each average.
- Low. Average initial/final percentage equity ≤ 42.5%
- Medium. Average initial/final percentage equity between 42.5% and 57.5%
- High. Average initial/final percentage equity > 57.5%
Future Work
The goal of assigning risk labels to age-based investment glide paths is to create a summary page for each age-based investment glide path that provides consumers with useful insights and information about the glide path.
In addition to a risk category based on the average of the initial and final percentage equity in the glide path, there are several other metrics that are easy to calculate and worth displaying on the summary page. The full set of metrics are as follows:
- Risk Category (Low, Medium, High)
- Initial Percentage Equity
- Final Percentage Equity
- Average of Initial and Final Percentage Equity (X)
- Average Percentage Equity Across All Waypoints (Y)
- Delayed Onset of the Age-Based Investment Glide Path (Yes, if first two percentage equities in the glide path are the same)
- Curvature of Age-Based Investment Glide Path (Y – X)
- Exposure to Foreign Stock Investments (percentage of investment assets that are invested in foreign stocks)
- Exposure to Real Estate Investments (percentage of investment assets that are invested in real estate, REITs and similar investments)
- Market Capitalization Mix (Small-Cap, Mid-Cap, Large-Cap)
- Investment Style (Growth, Value, Blended)
- Number of Age Ranges
Note that number of age ranges is not a meaningful distinction based on the impact on investment performance (risk and return), but nevertheless may be of interest to consumers.


